

The truth is, most site problems do not start with bad concrete or a missing drawing. They start with a programme that nobody on site could read. A Gantt chart is the picture of your whole project in time, and if you can read it, you can see a delay coming weeks before it hits you.
In simple terms, a Gantt chart is a bar chart where each bar is one activity. The length of the bar is how long the work takes, and its position shows when it starts and finishes. Site supervisors use it to order labour and materials, engineers use it to plan sequence, quantity surveyors use it to forecast cash flow, and architects and MEP teams use it to know when they get access to each floor.
This guide shows you how to read a construction programme step by step, the way it is actually used on Kenyan sites. By the end you will be able to find the critical path, read float, and use the chart in your weekly site meeting.
Quick Answer: To read a Gantt chart, start with the activity list on the left, follow each bar across the timeline to see its start, duration and finish, then trace the dependency links to find the critical path, which is the chain of activities that decides your completion date.
What does each part of a construction Gantt chart show?
Before reading any bar, learn the parts of the chart. Every programme, whether it comes from Microsoft Project, Primavera P6 or a simple Excel sheet, uses the same building blocks.
| Element | What it shows | How you use it on site |
|---|---|---|
| Activity list (left side) | Work items grouped by element or trade | Know what is planned and in which order |
| Timeline (top) | Days, weeks or months | Match work to the calendar and the rainy seasons |
| Bar | Duration of one activity | Plan gangs, plant and materials for that period |
| Milestone (diamond) | A key date with zero duration | Slab pour, power connection, handover |
| Dependency arrow | Link between two activities | See what must finish before the next one starts |
| Critical path (often red) | Chain of activities with zero float | Know where any delay moves the completion date |
| Progress shading | Percentage complete | Compare planned against actual progress |
Most building and road contracts require the contractor to submit a programme soon after the commencement date. FIDIC Clause 8.3 sets this out clearly, and Kenyan public works contracts follow a similar approach. So you will meet this document at the very start of the job.
How do you read bars, dependencies and the critical path?
Reading a programme is a routine. Do it the same way every time and you will stop missing things. Here is the sequence to follow for any activity you are checking.
| Step | What to do | What to look for |
|---|---|---|
| 1 | Read the activity name and its parent group | Is it substructure, superstructure, finishes or services? |
| 2 | Find the start and finish dates | Dates or week numbers, and the working calendar used |
| 3 | Check the duration | Working days only, or does it include Sundays and wet days? |
| 4 | Trace the predecessors and successors | What must finish first, and what is waiting on this work |
| 5 | Read the float | How many days it can slip without moving completion |
| 6 | Compare with actual progress | Is the shading behind the status line? |
Honestly, step four is where most people stop too early. A bar on its own tells you when work is planned. The links tell you why it is planned then, and what breaks if it moves.
Dependency types you will meet
| Type | Meaning | Site example |
|---|---|---|
| Finish to Start (FS) | B starts only after A finishes | Blinding finishes, then reinforcement fixing starts |
| Start to Start (SS) | B starts a set time after A starts | Plastering starts 3 days after blockwork starts on the same floor |
| Finish to Finish (FF) | B cannot finish until A finishes | Electrical first fix finishes with the last wall chased |
| Start to Finish (SF) | B cannot finish until A starts | Rare. Temporary supply ends when the permanent supply starts |
Finish to Start is the most common link by far. A lag is a deliberate waiting time added to a link, such as 7 days curing between a slab pour and the start of the next lift of formwork loading.
Critical path and float
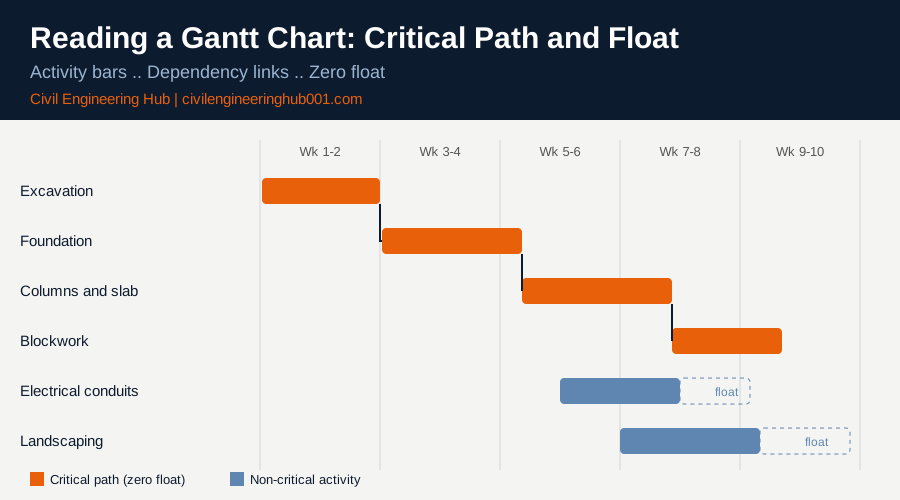
The critical path is the longest chain of linked activities from start to finish. Every activity on it has zero float, so a one day delay there is a one day delay to completion. Activities off the critical path have float, which is the number of days they can slip without moving the end date.
On a typical three storey building the critical path runs through excavation, foundations, columns, slabs, roof and then finishes. External works may carry weeks of float. But float is shared, and once one team uses it, the next delay on that chain becomes critical.
How do you use the Gantt chart to control work week by week?
The master programme is too big to run a site with. Good supervisors break it into shorter views that each gang can understand. The chart then becomes a daily tool and not just a document in the site office.
| Programme level | Period covered | Used by | Purpose |
|---|---|---|---|
| Master programme | Whole contract | PM, client, consultants | Completion date, milestones, cash flow |
| Three week look-ahead | Next 21 days | Site agent, foremen, subcontractors | Order materials, book plant, release labour |
| Weekly plan | 7 days | Foremen and trade leaders | Assign gangs and areas |
| Daily plan | 1 day | Gang leaders | Set output targets and safety briefing |
Use the look-ahead to check lead times. Ready-mix needs booking days in advance, reinforcement needs cutting and bending, and imported fittings can take weeks. If the chart says a slab pour is on Friday, steel must be fixed and inspected before that, not on that morning.
Also read the programme against technical rules. Curing and formwork striking times in line with BS 8110 guidance cannot be shortened just to save a day. Work at height and excavations must also follow the Occupational Safety and Health Act, 2007 and the Building Operations and Works of Engineering Construction Rules, so the programme must allow time for safe access and inspection.
What should you do when the site falls behind programme?
Delays are normal. Hiding them is what turns a small problem into a dispute. In Kenya, the long rains from March to May and the short rains from October to December regularly affect earthworks, concreting and roofing, so a good programme already allows for them.
- Record the delay the same day in the daily site report, with the cause and the activities affected.
- Check whether the delayed activity is on the critical path or only uses float.
- Give written notice to the supervising officer as required by the conditions of contract.
- Prepare a recovery plan: extra gangs, extra shifts, or resequencing of non-critical work.
- Submit a revised programme and, where the cause is not the contractor’s fault, claim an extension of time.
Avoid these common mistakes: reading only the dates and ignoring the links, updating the chart once a month instead of weekly, and treating float as private to one subcontractor. The programme only works when everyone on the team reads the same version.
How does the Gantt chart connect every trade on the team?
The chart is where every profession meets. A delay by the mason becomes a delay for the electrician, the plumber, the tiler and the painter. If you only read your own bar, you miss the effect you have on everyone else.
| Professional | What to read on the chart | Question to ask |
|---|---|---|
| Civil and structural engineer | Foundation, frame and slab sequence | Are inspections and cube results built into the durations? |
| Architect | Finishes and fit-out dates | Are samples and shop drawings approved before the bar starts? |
| Quantity surveyor | Milestones and progress percentages | Does the cash flow match the planned valuations? |
| Mason, tiler and artisan | Blockwork, screed, plaster and tiling bars | What area is released to me, and on which date? |
| Electrician and plumber | First fix, second fix and testing | Are conduits and sleeves in before the slab is poured? |
| Site supervisor and foreman | Three week look-ahead | Do I have labour, plant and materials for each start date? |
Here is a practical example. The programme shows a first floor slab pour on a Friday. The electrician must have conduits and boxes fixed, the plumber must have sleeves and pipe runs in place, and the engineer must have signed off the reinforcement. If any one of them is late, the pour moves, and every bar after it moves too.
This is why good supervisors hold a short coordination talk every Monday morning, with the chart on the table. Each trade states what they will finish this week and what they need from the others. Problems get solved on Monday, and not discovered on Friday during the pour.
The same chart helps the quantity surveyor and the project manager. Planned progress becomes the basis for valuation, and a gap between planned and actual progress is an early warning on both time and cost. When you read the programme this way, it stops being a scheduling document and becomes your main site control tool.
Frequently Asked Questions
Q: What is the difference between a Gantt chart and a construction programme?
A Gantt chart is the visual format, while the construction programme is the plan itself. Most programmes are shown as Gantt charts because bars make sequence and overlap easy to see. The programme also contains durations, logic links and resources behind the bars.
Q: Which software is used to build Gantt charts on Kenyan sites?
Microsoft Project and Primavera P6 are the most common on larger building and road projects. Many smaller contractors use Excel or free online tools. The software does not change how you read the chart, so learn the logic first and the tool second.
Q: Who is responsible for updating the programme?
The contractor prepares and updates it, usually led by the project manager or planning engineer. The supervising officer reviews and accepts it. Site supervisors and foremen give the progress data that keeps it accurate, so your daily reports matter more than most people think.
Conclusion
A Gantt chart is not decoration for the site office wall. It tells you what to order, who to call and where the next problem will appear. Learn the parts, trace the links, find the critical path and update it every week.
That habit separates supervisors who react to delays from those who prevent them. Start with your own project’s programme tomorrow morning and read three activities all the way through.
Want more practical construction knowledge delivered directly to you?
Subscribe to our YouTube channel: https://www.youtube.com/@TheCivilEngineeringHub-001
PS: Join our engineering WhatsApp community for daily learning at +254731393520